Category: Momentum · Complexity: ★★★☆☆ (3/5)
Tags: momentum, live-overlay, price
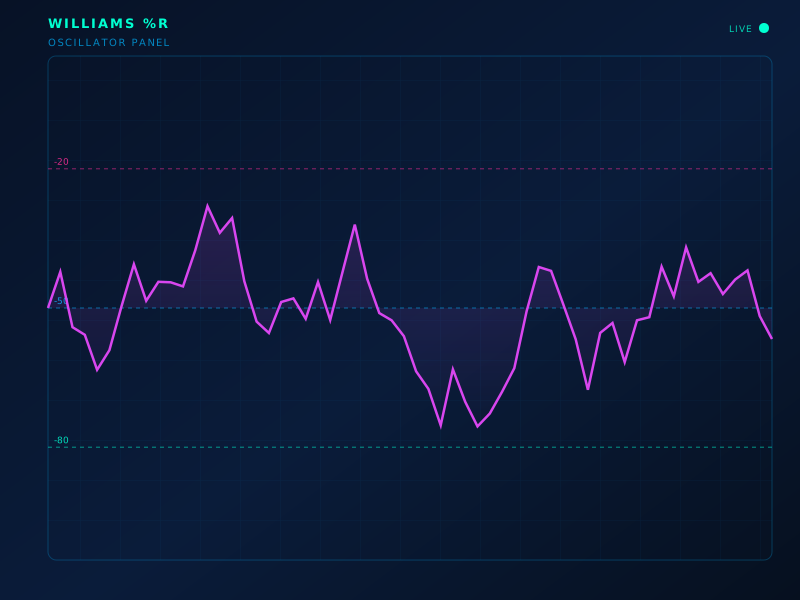
Live chart overlay: WPR
Formula
%R = −100 · (H_n − C) / (H_n − L_n)
How to read
Scale is 0 to −100. Readings near 0 = close at highs (stretch up); near −100 = close at lows. Similar to stochastic, inverted.
Limitations
Pins in trends. Thresholds (−20/−80) are conventions, not laws.
Typical settings
14
Williams %R is part of the ClearPath Encyclopedia of Indicators — 190 models explained with standard SVG illustrations, so you can study an indicator before you put it on a live chart.