Category: Trend · Complexity: ★★☆☆☆ (2/5)
Tags: trend, live-overlay, price
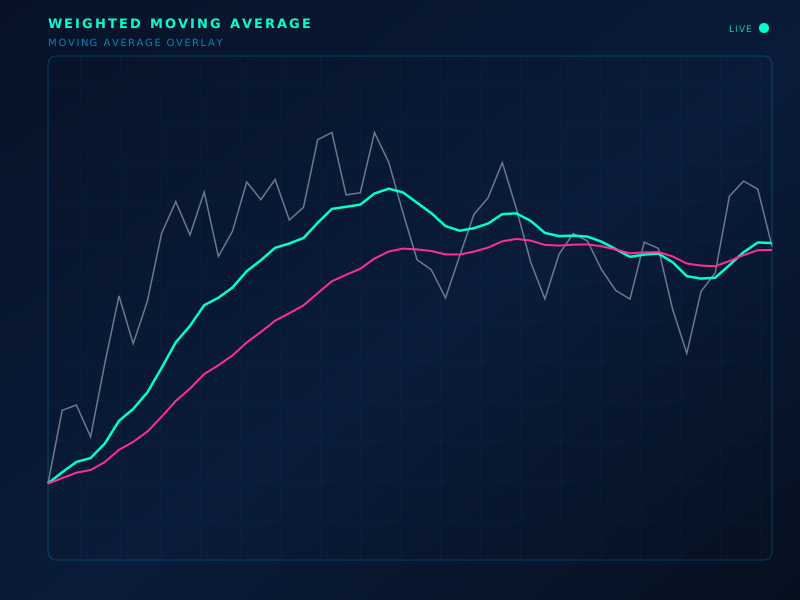
Live chart overlay: WMA
Formula
WMA_n = Σ(i·P_i) / Σ(i) for i = 1…n (recent bars weighted more)
How to read
Sits between SMA and EMA: recent price counts more, older price still in the average. Use like any trend MA.
Limitations
Lags and still whipsaws. Not volume-weighted.
Typical settings
20 or 50
Weighted Moving Average is part of the ClearPath Encyclopedia of Indicators — 190 models explained with standard SVG illustrations, so you can study an indicator before you put it on a live chart.