Category: Volume · Complexity: ★★☆☆☆ (2/5)
Tags: volume, live-overlay, volume
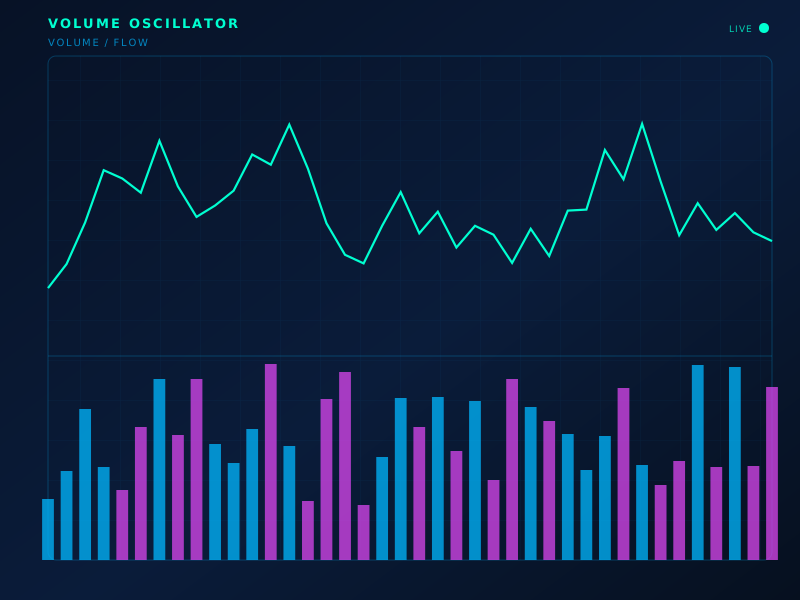
Live chart overlay: VO
Formula
VO = SMA(V, short) − SMA(V, long) (or percent form)
How to read
Positive VO = short-term participation above the longer baseline — a surge. Negative = quiet tape.
Limitations
No price direction. Surges happen on both panics and breakouts.
Typical settings
5 / 20
Volume Oscillator is part of the ClearPath Encyclopedia of Indicators — 190 models explained with standard SVG illustrations, so you can study an indicator before you put it on a live chart.