Category: Volume · Complexity: ★★★☆☆ (3/5)
Tags: volume, live-overlay, volume
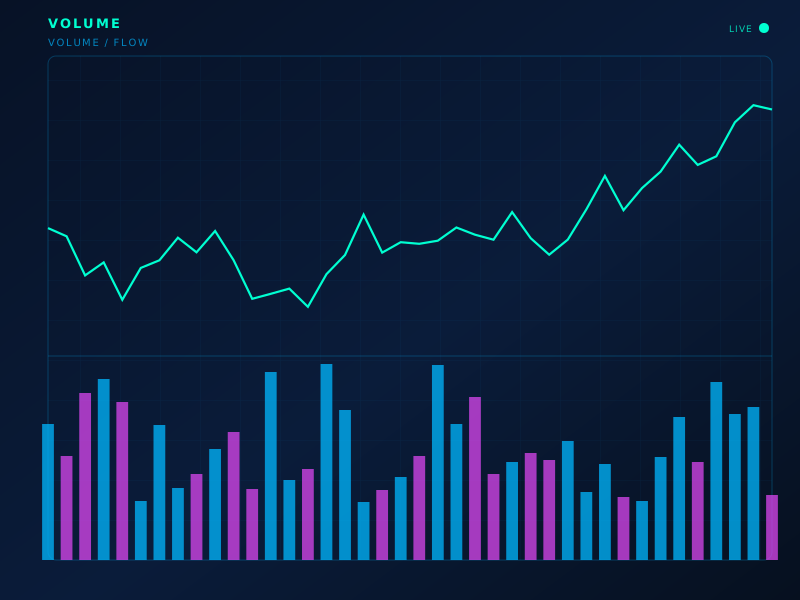
Live chart overlay: VOL
Formula
V_t = traded units in the bar (exchange-reported)
How to read
Rising volume on a directional close confirms participation. Dry-up can precede breaks; climax spikes can mark exhaustion.
Limitations
FX spot volume is often tick volume, not true notional. Compare like-with-like.
Typical settings
Raw + 20 SMA of volume
Volume is part of the ClearPath Encyclopedia of Indicators — 190 models explained with standard SVG illustrations, so you can study an indicator before you put it on a live chart.