Category: Technical · Complexity: ★★☆☆☆ (2/5)
Tags: technical, live-overlay, price
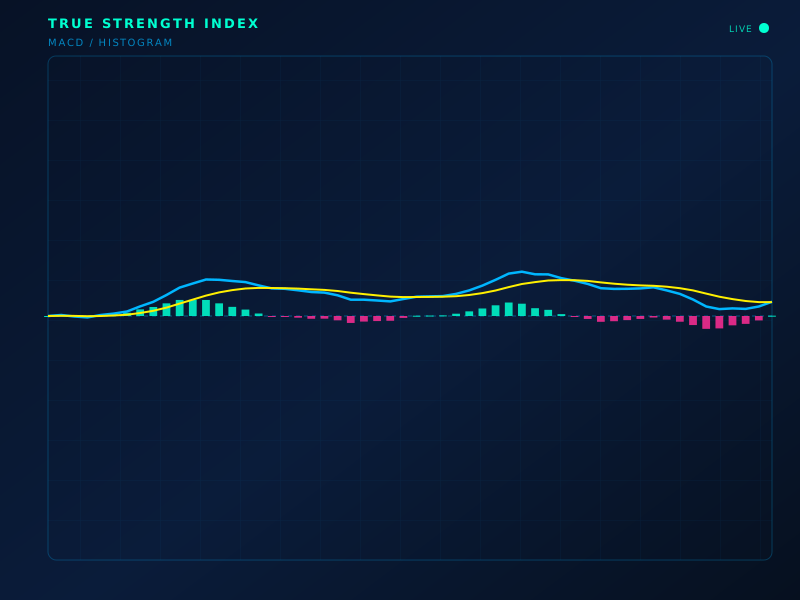
Live chart overlay: TSI
Formula
TSI = 100 · EMA(EMA(ΔC), r) / EMA(EMA(|ΔC|), r)
How to read
Double-smoothed momentum. Signal-line crosses and divergences time swings with less noise than raw momentum.
Limitations
Still lags turning points. Settings are sensitive.
Typical settings
25 / 13, signal 13
True Strength Index is part of the ClearPath Encyclopedia of Indicators — 190 models explained with standard SVG illustrations, so you can study an indicator before you put it on a live chart.