Category: Trend · Complexity: ★★★☆☆ (3/5)
Tags: trend, live-overlay, price
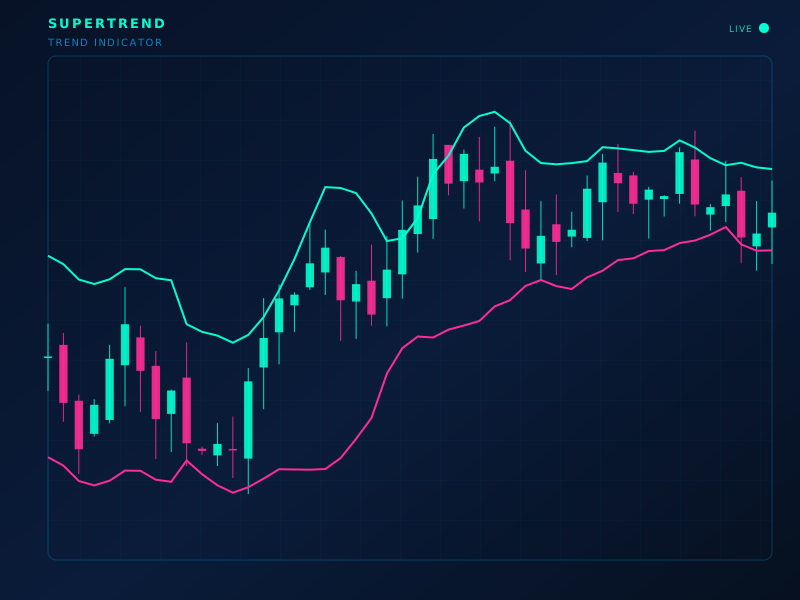
Live chart overlay: SUPERTREND
Formula
Bands = HL2 ± m·ATR(n); SuperTrend trails the active band and flips on close-through
How to read
Line below price and green = uptrend; above and red = downtrend. Flip is the regime change.
Limitations
ATR multiples lag violent spikes. Choppy markets produce many flips.
Typical settings
ATR 10, multiplier 3
SuperTrend is part of the ClearPath Encyclopedia of Indicators — 190 models explained with standard SVG illustrations, so you can study an indicator before you put it on a live chart.