Category: Trend · Complexity: ★☆☆☆☆ (1/5)
Tags: trend, live-overlay, price
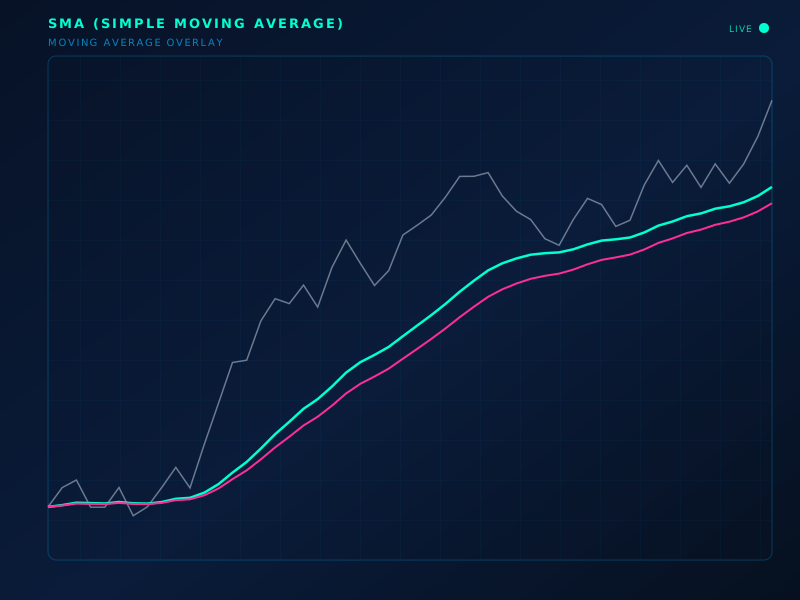
Live chart overlay: SMA
Formula
SMA_n = (P_t + P_{t-1} + … + P_{t-n+1}) / n
How to read
Price above a rising SMA favors an uptrend; below a falling SMA favors a downtrend. The slope matters more than a single cross.
Limitations
Lags price. Whipsaws in ranges. Does not measure volatility or volume.
Typical settings
20 (swing), 50 (intermediate), 200 (long-term trend)
SMA (Simple Moving Average) is part of the ClearPath Encyclopedia of Indicators — 190 models explained with standard SVG illustrations, so you can study an indicator before you put it on a live chart.