Category: Technical · Complexity: ★☆☆☆☆ (1/5)
Tags: technical, live-overlay, price
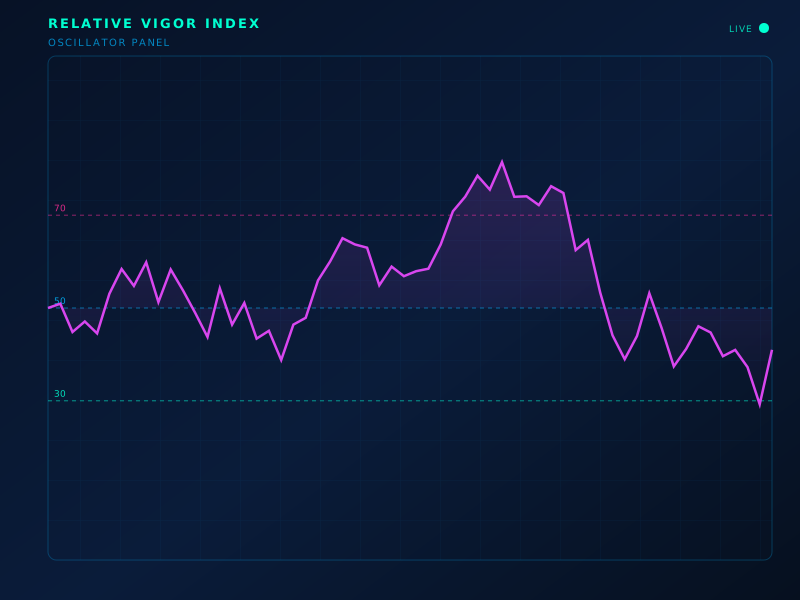
Live chart overlay: RVI
Formula
RVI = SMA(C−O) / SMA(H−L) with a 4-weight smoother; signal is a 4-period SMA of RVI
How to read
Measures conviction of closes vs the bar range. Signal-line crosses time swings.
Limitations
Can stay one-sided in strong trends.
Typical settings
10
Relative Vigor Index is part of the ClearPath Encyclopedia of Indicators — 190 models explained with standard SVG illustrations, so you can study an indicator before you put it on a live chart.