Category: Momentum · Complexity: ★★★☆☆ (3/5)
Tags: momentum, live-overlay, price
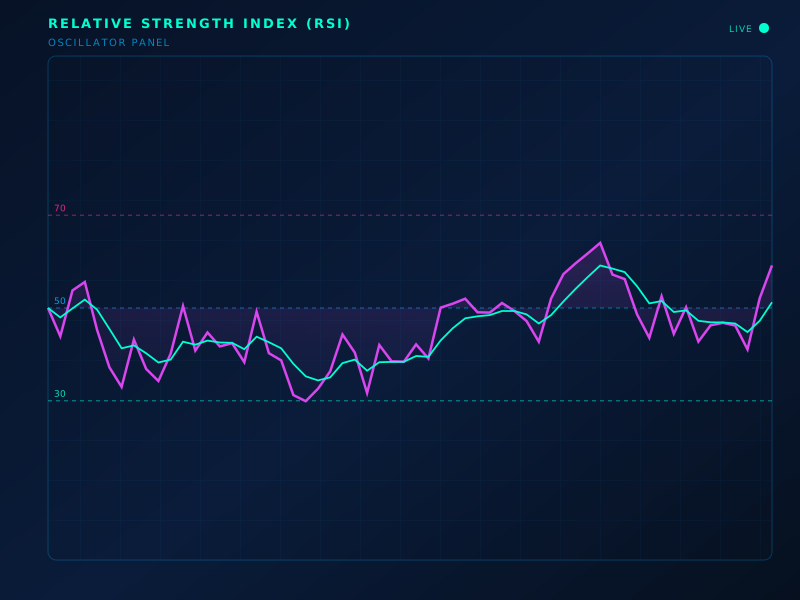
Live chart overlay: RSI
Formula
RSI = 100 − 100/(1 + RS), RS = avg gain / avg loss over n (Wilder smoothing)
How to read
Classic 70/30 (or 80/20 in trends) for stretch. 50 is the momentum midline. Divergence with price can warn of fading thrust.
Limitations
Can stay overbought in strong trends. Not a standalone reversal oracle.
Typical settings
14; 2-period for short-term mean reversion
Relative Strength Index (RSI) is part of the ClearPath Encyclopedia of Indicators — 190 models explained with standard SVG illustrations, so you can study an indicator before you put it on a live chart.