Category: Technical · Complexity: ★★☆☆☆ (2/5)
Tags: technical, live-overlay, price
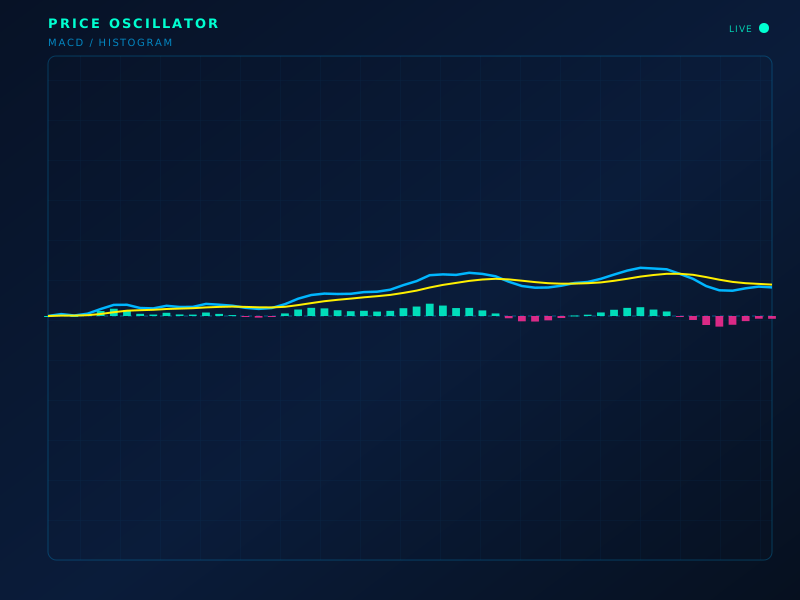
Live chart overlay: PPO
Formula
PPO-style: 100 · (EMA_fast − EMA_slow) / EMA_slow or raw MA difference
How to read
Percentage form lets you compare momentum across different price levels. Read like MACD.
Limitations
Same crossover lag as MACD.
Typical settings
12 / 26
Price Oscillator is part of the ClearPath Encyclopedia of Indicators — 190 models explained with standard SVG illustrations, so you can study an indicator before you put it on a live chart.