Category: Trend · Complexity: ★☆☆☆☆ (1/5)
Tags: trend, live-overlay, price
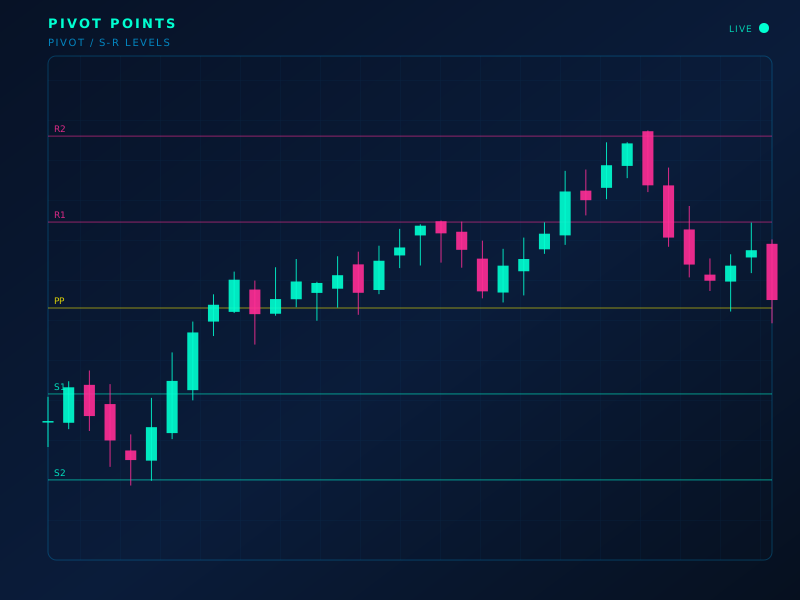
Live chart overlay: PIVOT
Formula
PP=(H+L+C)/3; R1=2·PP−L; S1=2·PP−H; R2=PP+(H−L); S2=PP−(H−L)
How to read
Intraday magnet and S/R. Opens above PP often lean toward R levels; below toward S levels.
Limitations
Daily pivots reset; they are not a trend system. Less useful on strong trend days that ignore levels.
Typical settings
Classic floor-trader (prior day H/L/C)
Pivot Points is part of the ClearPath Encyclopedia of Indicators — 190 models explained with standard SVG illustrations, so you can study an indicator before you put it on a live chart.