Category: Volume · Complexity: ★★★☆☆ (3/5)
Tags: volume, live-overlay, volume
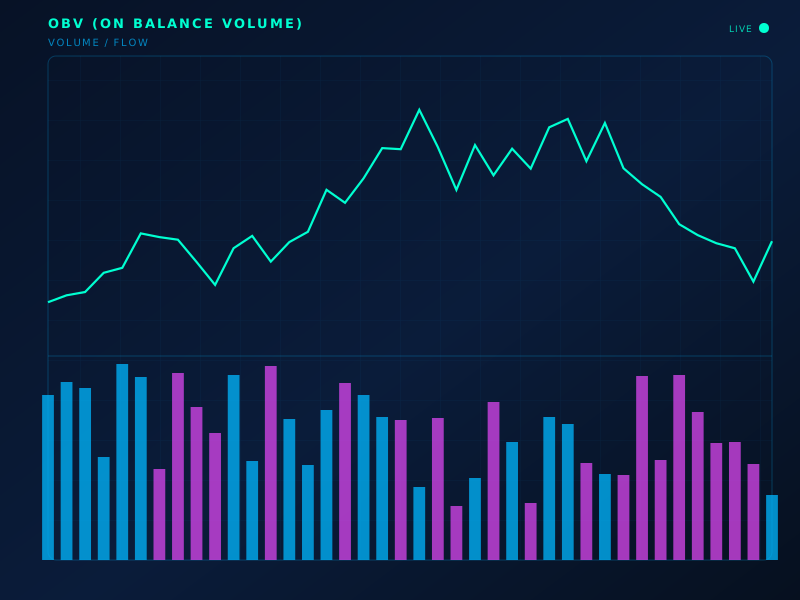
Live chart overlay: OBV
Formula
OBV_t = OBV_{t-1} + V if C↑; −V if C↓; 0 if unchanged
How to read
Rising OBV with rising price confirms. Price up / OBV flat or down is a divergence warning.
Limitations
Uses all volume on the close direction — crude. Needs clean volume data.
Typical settings
Cumulative; optional SMA smooth
OBV (On Balance Volume) is part of the ClearPath Encyclopedia of Indicators — 190 models explained with standard SVG illustrations, so you can study an indicator before you put it on a live chart.