Category: Trend · Complexity: ★☆☆☆☆ (1/5)
Tags: trend, live-overlay, price
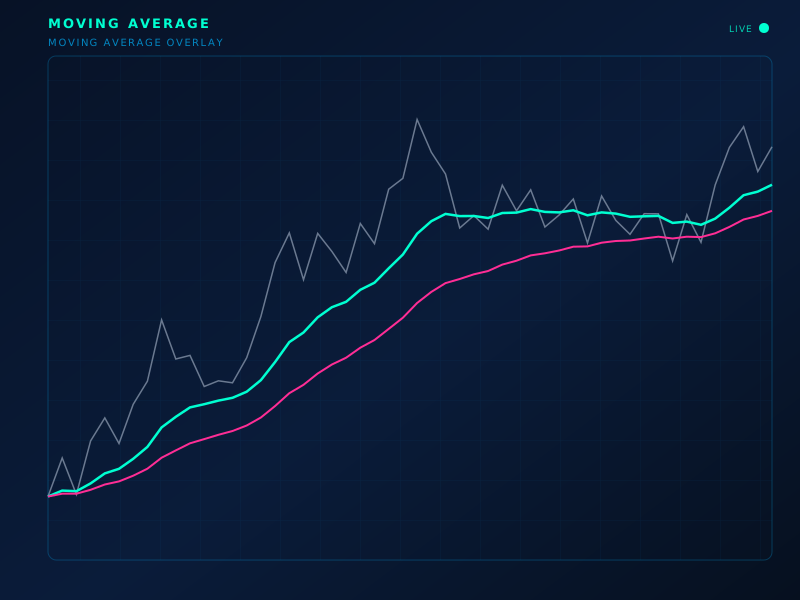
Live chart overlay: SMA
Formula
MA_n = average of the last n closes (SMA, EMA, or WMA depending on type)
How to read
Treat as a dynamic trend filter and support/resistance. Crosses of a faster MA through a slower MA mark regime shifts.
Limitations
Any MA is a lagging smoother. Fast lengths fake out; slow lengths miss turns.
Typical settings
20 / 50 / 200 depending on timeframe
Moving Average is part of the ClearPath Encyclopedia of Indicators — 190 models explained with standard SVG illustrations, so you can study an indicator before you put it on a live chart.