Category: Trend · Complexity: ★★☆☆☆ (2/5)
Tags: trend, live-overlay, price
Live chart overlay: LRC
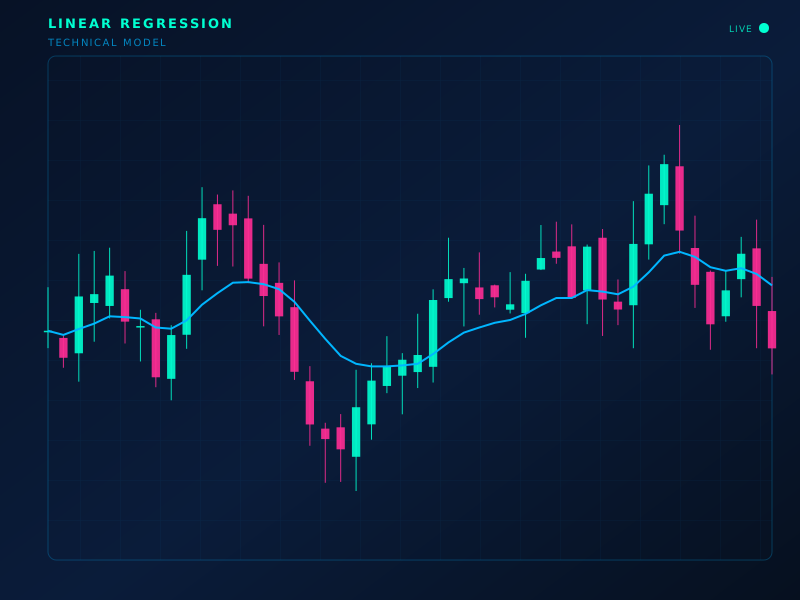
Formula
Least-squares line: P ≈ a + b·t over the lookback window
How to read
Slope b is drift. Price far above/below the line is statistically stretched versus the fitted trend.
Limitations
Refits every bar (the line moves). Not a crystal ball for the next close.
Typical settings
20 or 50
Linear Regression is part of the ClearPath Encyclopedia of Indicators — 190 models explained with standard SVG illustrations, so you can study an indicator before you put it on a live chart.