Category: Technical · Complexity: ★☆☆☆☆ (1/5)
Tags: technical, live-overlay, price
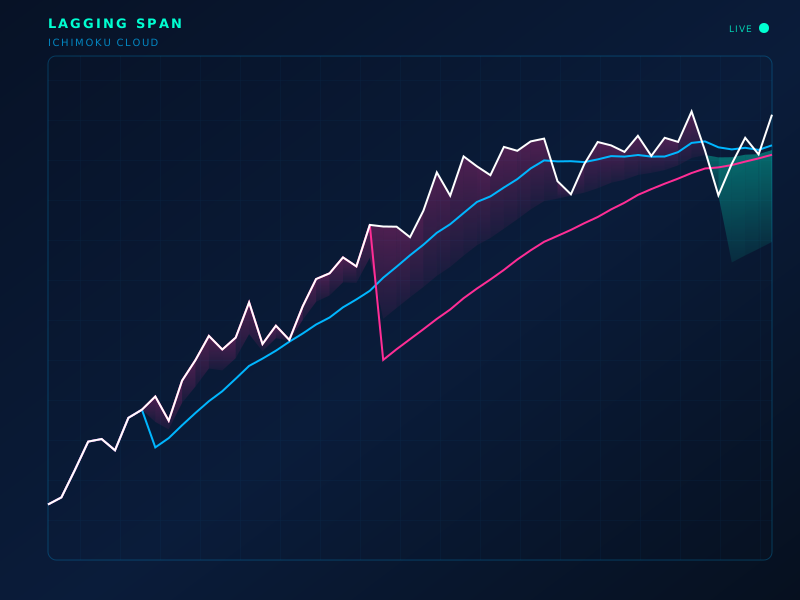
Live chart overlay: ICHIMOKU
Formula
Chikou = Close_t plotted at t−26
How to read
Chikou above price 26 bars ago supports bullish momentum; below supports bearish. Used with the full Ichimoku system.
Limitations
By design it looks backward. Do not treat as a leading oscillator.
Typical settings
26-bar displacement
Lagging Span is part of the ClearPath Encyclopedia of Indicators — 190 models explained with standard SVG illustrations, so you can study an indicator before you put it on a live chart.