Category: Trend · Complexity: ★★★☆☆ (3/5)
Tags: trend, live-overlay, price
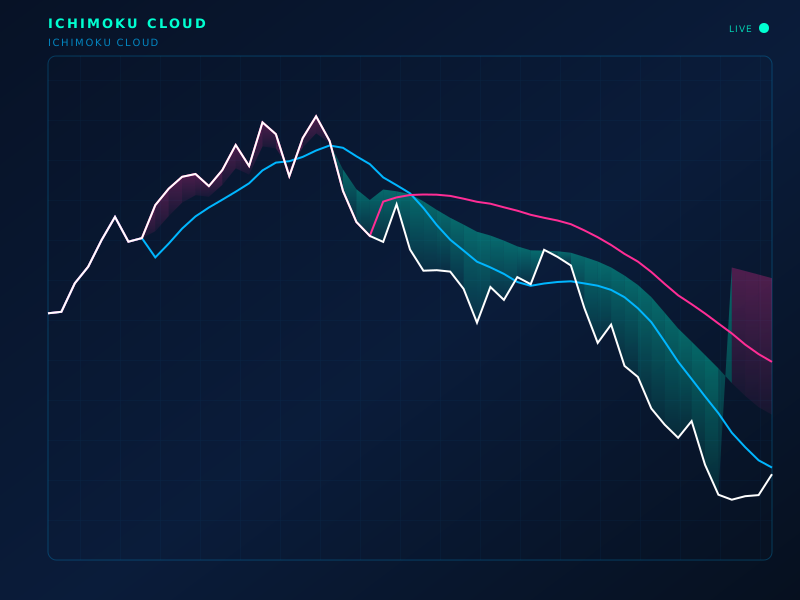
Live chart overlay: ICHIMOKU
Formula
Tenkan=(9-high+9-low)/2; Kijun=(26-high+26-low)/2; Span A=(Tenkan+Kijun)/2; Span B=(52-high+52-low)/2; Chikou=close plotted −26
How to read
Price above a green cloud is bullish structure; below a red cloud is bearish. Tenkan/Kijun crosses and Chikou vs past price confirm.
Limitations
Busy overlay. Default 9/26/52 assumes a Tokyo-session day count, not magic numbers.
Typical settings
9 / 26 / 52
Ichimoku Cloud is part of the ClearPath Encyclopedia of Indicators — 190 models explained with standard SVG illustrations, so you can study an indicator before you put it on a live chart.