Category: Trend · Complexity: ★★☆☆☆ (2/5)
Tags: trend, live-overlay, price
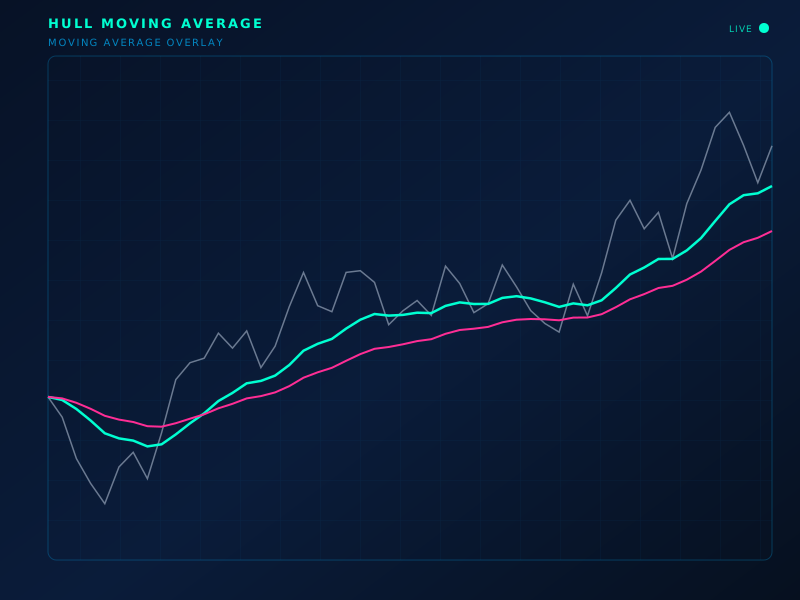
Live chart overlay: HMA
Formula
HMA = WMA( 2·WMA(n/2) − WMA(n), √n )
How to read
Color/slope changes flag trend flips with less lag than SMA. Designed to stay smooth while turning sooner.
Limitations
Can still flip in ranges. Not a volatility stop.
Typical settings
16 or 21
Hull Moving Average is part of the ClearPath Encyclopedia of Indicators — 190 models explained with standard SVG illustrations, so you can study an indicator before you put it on a live chart.