Category: Volatility · Complexity: ★☆☆☆☆ (1/5)
Tags: volatility, live-overlay, volatility
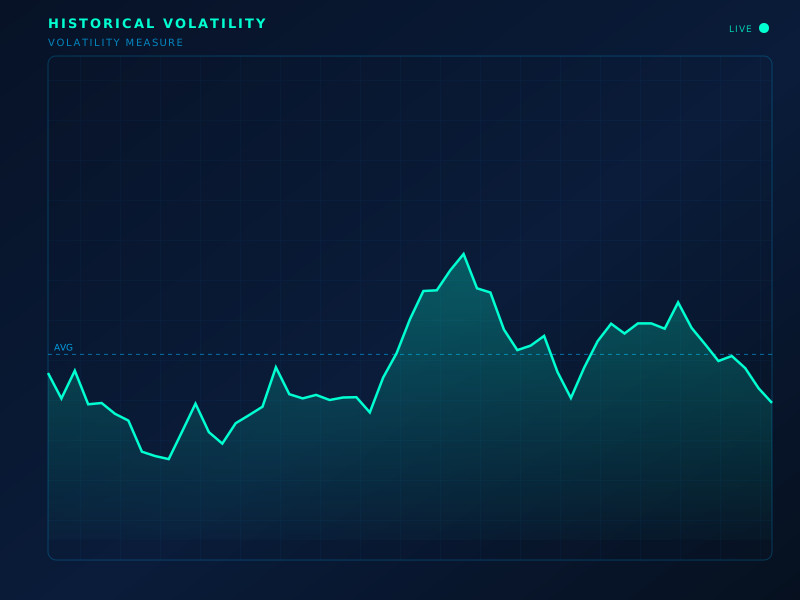
Live chart overlay: HV
Formula
HV = σ(log returns) · √(periods per year)
How to read
Realized movement. Rising HV = market has been swinging more. Compare to implied vol for options context.
Limitations
Backward-looking. A quiet HV does not forbid a jump tomorrow.
Typical settings
20-day annualized
Historical Volatility is part of the ClearPath Encyclopedia of Indicators — 190 models explained with standard SVG illustrations, so you can study an indicator before you put it on a live chart.