Category: Momentum · Complexity: ★★☆☆☆ (2/5)
Tags: momentum, live-overlay, price
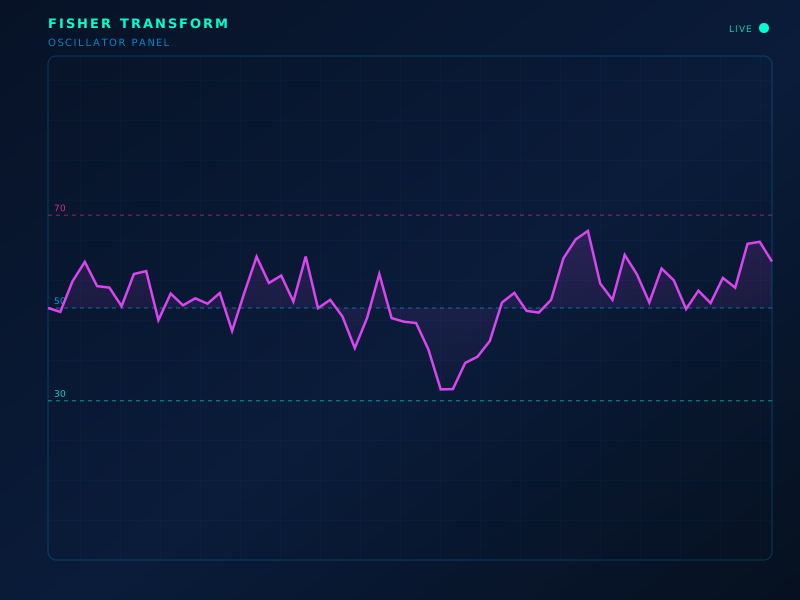
Live chart overlay: FT
Formula
Fisher = 0.5 · ln((1+x)/(1−x)) on a normalized price x ∈ (−0.999, 0.999)
How to read
Turns price into a near-Gaussian series so turning points sharpen. Crosses of Fisher and its trigger flag reversals.
Limitations
Can flip often. Normalization window matters.
Typical settings
10, trigger 1
Fisher Transform is part of the ClearPath Encyclopedia of Indicators — 190 models explained with standard SVG illustrations, so you can study an indicator before you put it on a live chart.