Category: Trend · Complexity: ★★☆☆☆ (2/5)
Tags: trend, live-overlay, price
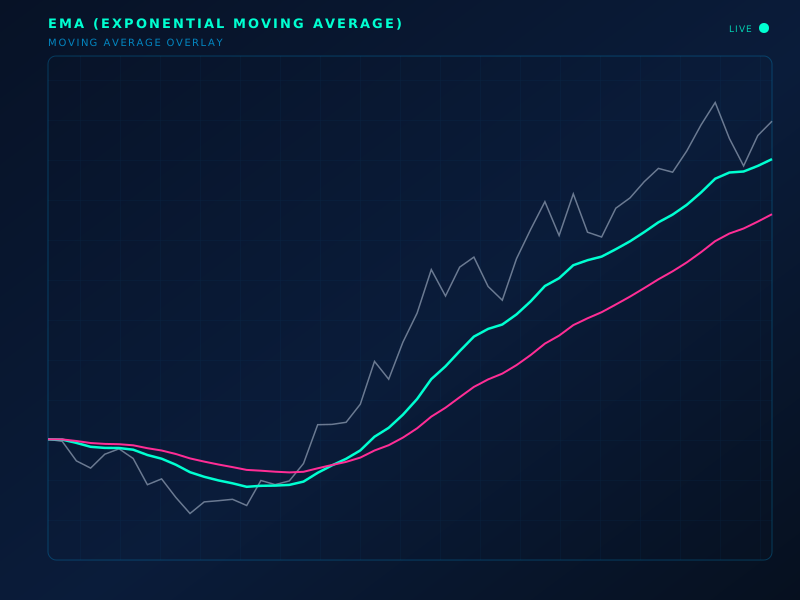
Live chart overlay: EMA
Formula
EMA_t = k·P_t + (1−k)·EMA_{t-1}, k = 2/(n+1)
How to read
Responds faster than SMA. Price/EMA relationship plus EMA slope define the trend. EMA crossovers are classic timing signals.
Limitations
Still lags. More sensitive to last bars, so noisier than SMA of the same length.
Typical settings
12 & 26 (MACD pair), 21, 50
EMA (Exponential Moving Average) is part of the ClearPath Encyclopedia of Indicators — 190 models explained with standard SVG illustrations, so you can study an indicator before you put it on a live chart.