Category: Momentum · Complexity: ★★☆☆☆ (2/5)
Tags: momentum, live-overlay, price
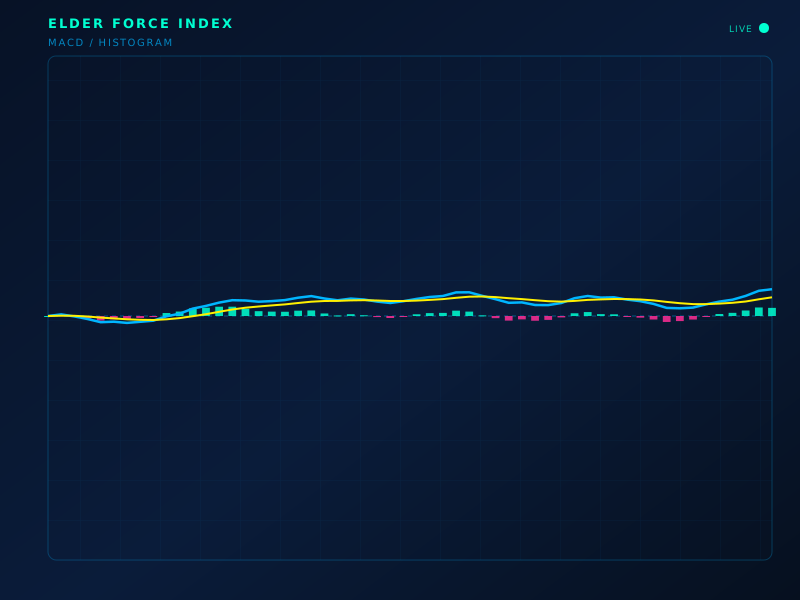
Live chart overlay: EFI
Formula
FI = (C_t − C_{t-1}) · V; then EMA(FI, n)
How to read
Zero-line shows whether bulls or bears had force. Divergences and EMA slope are the reads.
Limitations
A single huge bar dominates. Needs volume.
Typical settings
EMA 13 (or 2 for ticks)
Elder Force Index is part of the ClearPath Encyclopedia of Indicators — 190 models explained with standard SVG illustrations, so you can study an indicator before you put it on a live chart.