Category: Volume · Complexity: ★☆☆☆☆ (1/5)
Tags: volume, live-overlay, volume
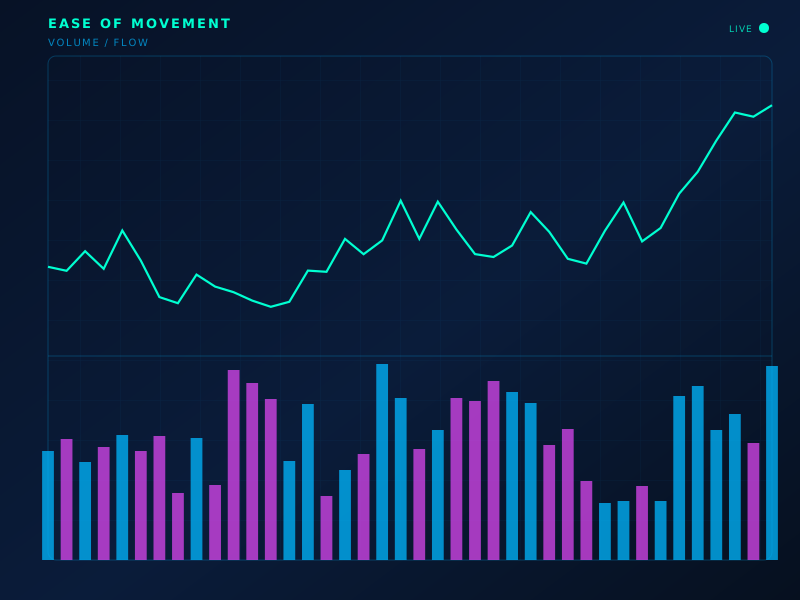
Live chart overlay: EOM
Formula
EMV = (mid_t − mid_{t-1}) / (V / (H−L)); often SMA-smoothed
How to read
High EMV = price advanced easily on light volume; low/negative = heavy work to move.
Limitations
Division by range/volume can explode on tiny bars.
Typical settings
14 SMA of EMV
Ease of Movement is part of the ClearPath Encyclopedia of Indicators — 190 models explained with standard SVG illustrations, so you can study an indicator before you put it on a live chart.