Category: Trend · Complexity: ★☆☆☆☆ (1/5)
Tags: trend, live-overlay, price
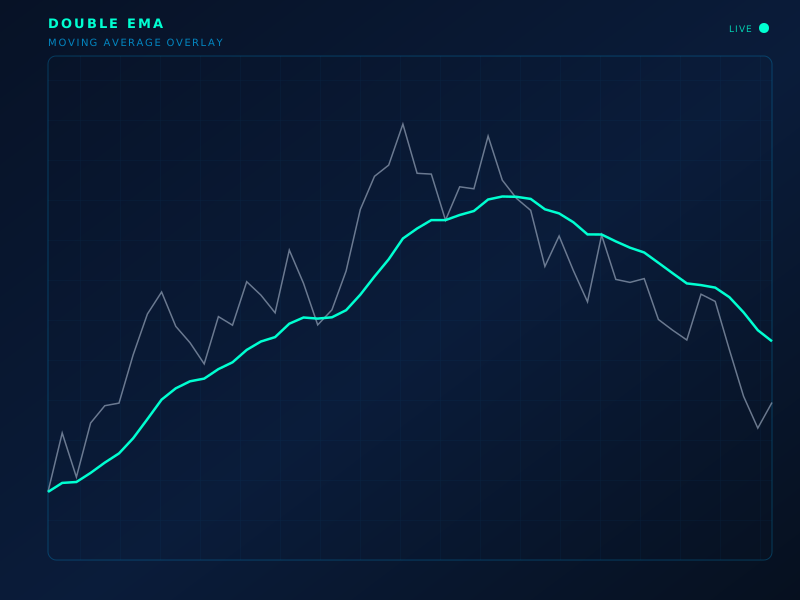
Live chart overlay: DEMA
Formula
DEMA = 2·EMA(n) − EMA(EMA(n))
How to read
Lower-lag trend line. Use like EMA but expect earlier turns and slightly more noise.
Limitations
Can overshoot. Not a standalone overbought/oversold tool.
Typical settings
21
Double EMA is part of the ClearPath Encyclopedia of Indicators — 190 models explained with standard SVG illustrations, so you can study an indicator before you put it on a live chart.