Category: Volatility · Complexity: ★★★☆☆ (3/5)
Tags: volatility, live-overlay, volatility
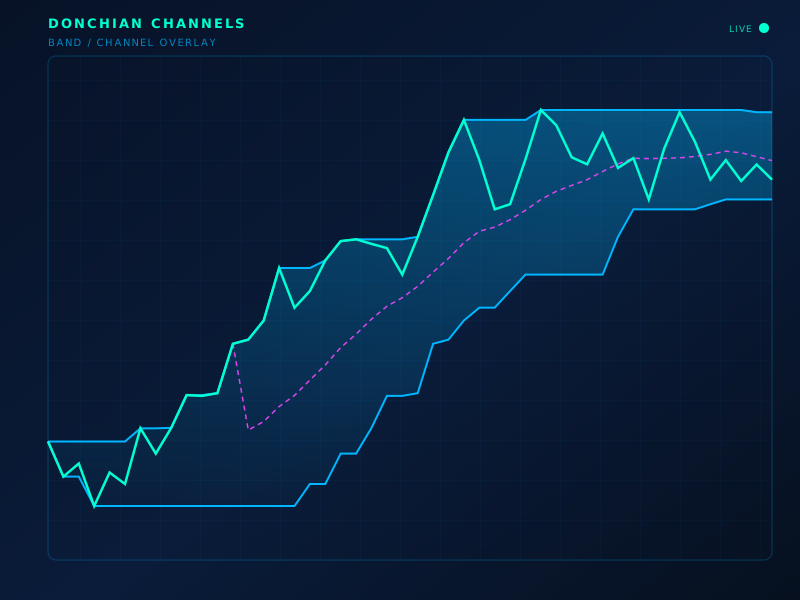
Live chart overlay: DC
Formula
Upper = max(H, n); Lower = min(L, n); Mid = (Upper+Lower)/2
How to read
Turtle-style breakout: close beyond the channel is a trend-following event. Mid is a mean reference.
Limitations
Whipsaws in ranges. Always in the market if you trade every breakout.
Typical settings
20 entry / 10 exit
Donchian Channels is part of the ClearPath Encyclopedia of Indicators — 190 models explained with standard SVG illustrations, so you can study an indicator before you put it on a live chart.