Category: Trend · Complexity: ★★☆☆☆ (2/5)
Tags: trend, live-overlay, price
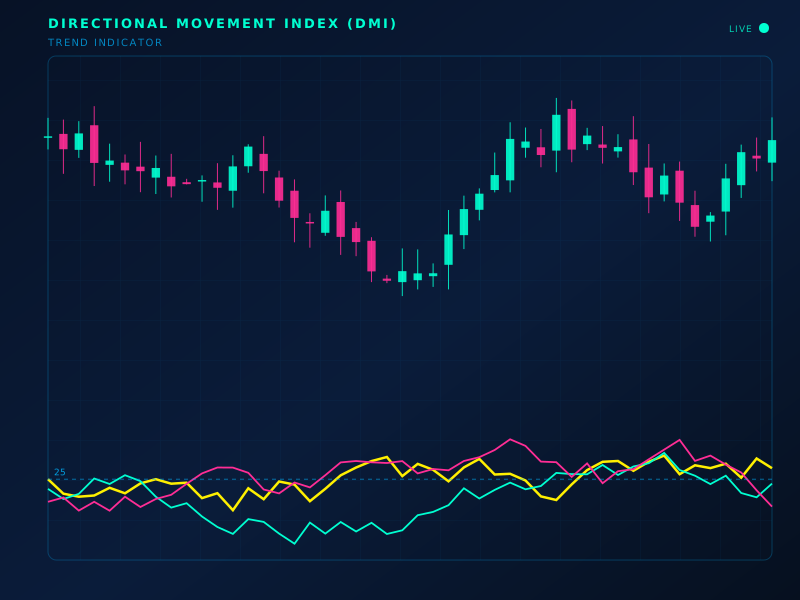
Live chart overlay: DMI
Formula
+DM = up-move when it exceeds down-move; −DM opposite; +DI/−DI = 100·smoothed DM / ATR
How to read
+DI above −DI favors upside direction; reverse favors downside. Pair with ADX for strength.
Limitations
Crossovers lag. Weak in tight ranges.
Typical settings
14
Directional Movement Index (DMI) is part of the ClearPath Encyclopedia of Indicators — 190 models explained with standard SVG illustrations, so you can study an indicator before you put it on a live chart.