Category: Momentum · Complexity: ★★☆☆☆ (2/5)
Tags: momentum, live-overlay, price
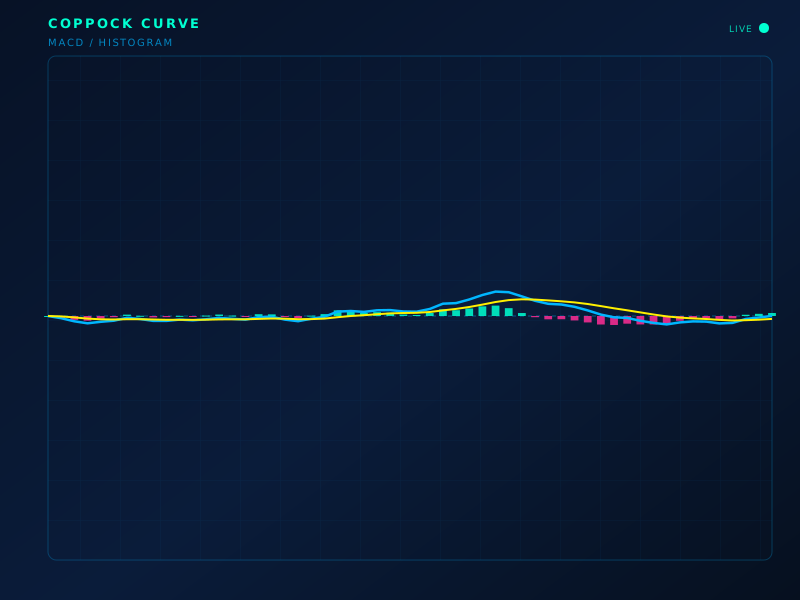
Live chart overlay: CC
Formula
WMA of (ROC_14 + ROC_11), typically on monthly closes
How to read
Long-horizon momentum. Historically watched for a turn up from deep negatives as a major equity buy cue — education, not a promise.
Limitations
Very slow. Built for monthly indexes, not scalping.
Typical settings
11 & 14 ROC, 10 WMA, monthly
Coppock Curve is part of the ClearPath Encyclopedia of Indicators — 190 models explained with standard SVG illustrations, so you can study an indicator before you put it on a live chart.