Category: Technical · Complexity: ★★★☆☆ (3/5)
Tags: technical, study-card, price
Study card — educational illustration only (no live overlay in Charts).
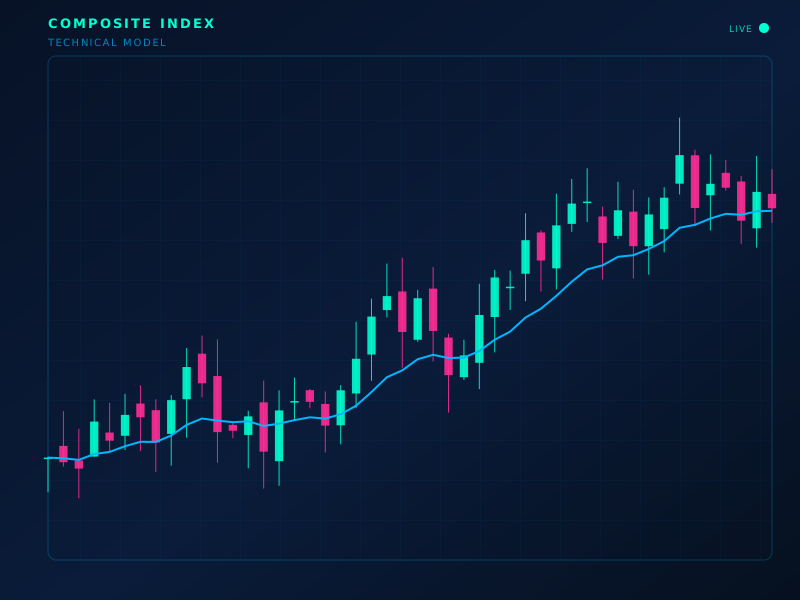
Formula
Composite Index is computed from price, volume, breadth, or macro prints depending on class (Technical). See the description for the defining inputs.
How to read
Read Composite Index as a labeling tool: it describes a condition (trend, stretch, participation, or macro). Confirm with price structure, not the indicator alone. This entry is a study card — not every encyclopedia model has a live chart overlay.
Limitations
Composite Index can lag, repaint (some drawings), or stay extreme in trends. It is not financial advice and not a broker signal.
Typical settings
Use the author's original defaults first; change one parameter at a time.
Composite Index is part of the ClearPath Encyclopedia of Indicators — 190 models explained with standard SVG illustrations, so you can study an indicator before you put it on a live chart.