Category: Volatility · Complexity: ★★☆☆☆ (2/5)
Tags: volatility, live-overlay, volatility
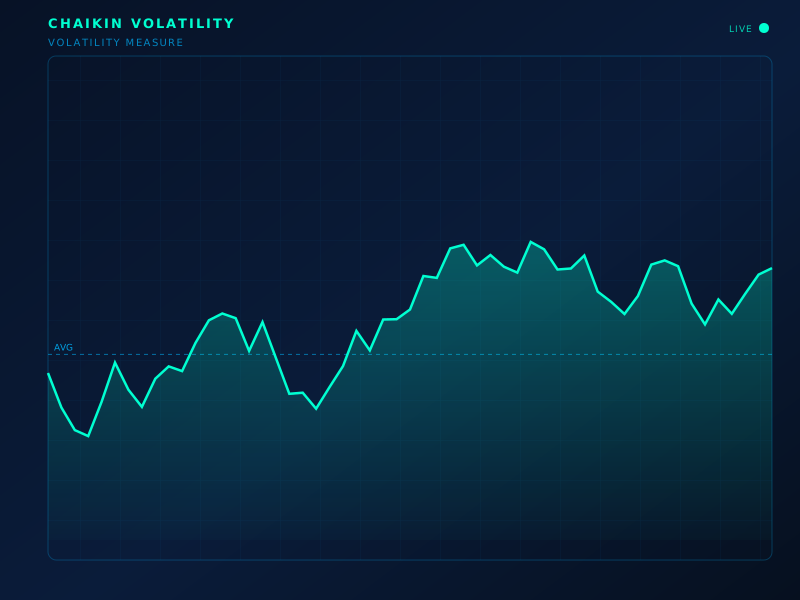
Live chart overlay: CHV
Formula
ROC of EMA(H−L) (how fast the range itself is changing)
How to read
Rising Chaikin vol = expanding high-low ranges; falling = compressing ranges (often before a break).
Limitations
No direction. Range ≠ volume.
Typical settings
EMA 10, ROC 10
Chaikin Volatility is part of the ClearPath Encyclopedia of Indicators — 190 models explained with standard SVG illustrations, so you can study an indicator before you put it on a live chart.