Category: Trend · Complexity: ★★☆☆☆ (2/5)
Tags: trend, live-overlay, price
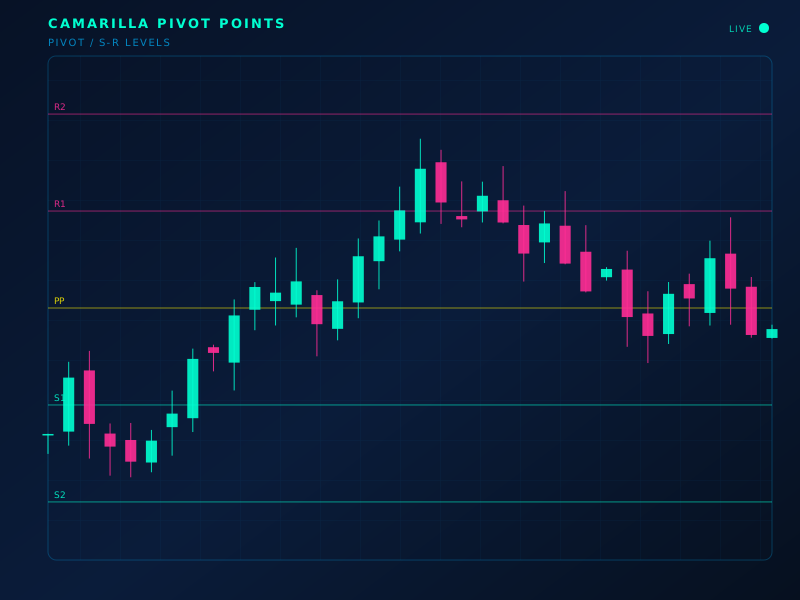
Live chart overlay: PIVOT
Formula
R4 = C + (H−L)·1.1/2; R3 = C + (H−L)·1.1/4; S3/S4 mirrored below the close
How to read
R3/S3 are mean-reversion zones; R4/S4 are breakout levels. Popular for intraday fades.
Limitations
Calibrated to typical daily ranges; news days blow through them.
Typical settings
Prior day H/L/C
Camarilla Pivot Points is part of the ClearPath Encyclopedia of Indicators — 190 models explained with standard SVG illustrations, so you can study an indicator before you put it on a live chart.