Category: Volatility · Complexity: ★★★☆☆ (3/5)
Tags: volatility, live-overlay, volatility
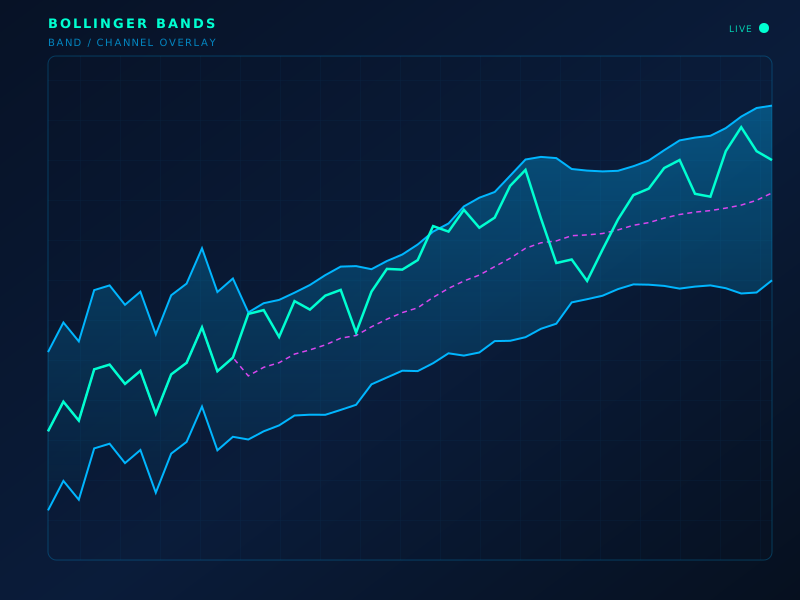
Live chart overlay: BB
Formula
Middle = SMA(n); Upper/Lower = Middle ± k·σ(n)
How to read
Squeeze (narrow width) often precedes expansion. Band walks happen in trends; fades work better in ranges.
Limitations
σ assumes a stable distribution. Breakouts can fail; touches are not automatic reversals.
Typical settings
20, 2σ
Bollinger Bands is part of the ClearPath Encyclopedia of Indicators — 190 models explained with standard SVG illustrations, so you can study an indicator before you put it on a live chart.