Category: Volume · Complexity: ★★☆☆☆ (2/5)
Tags: volume, live-overlay, volume
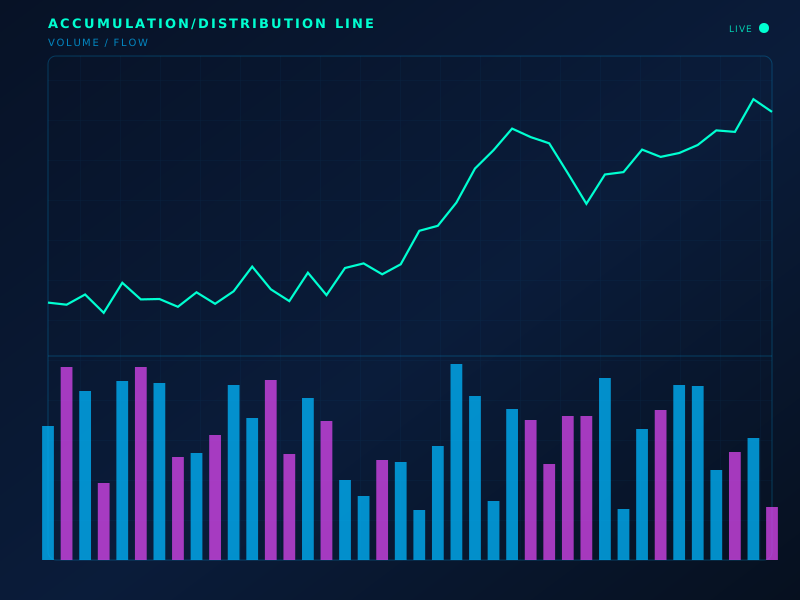
Live chart overlay: AD
Formula
MFM = ((C−L)−(H−C))/(H−L); AD = Σ(MFM·V)
How to read
Closes near highs add volume; near lows subtract. Divergence with price flags flow disagreement.
Limitations
Uses H-L location, not true bid/ask aggression. Gaps can distort.
Typical settings
Cumulative
Accumulation/Distribution Line is part of the ClearPath Encyclopedia of Indicators — 190 models explained with standard SVG illustrations, so you can study an indicator before you put it on a live chart.